Welcome to the Search Prognosis Application!
About this application:
Rapid identification of the best possible Human Leukocyte Antigen (HLA) match for a searching patient in need of a hematopoietic stem cell transplant is critical to transplant success. The Search Prognosis Application provides a simple scoring system based on a patient’s race/ethnicity and genotype frequency that can provide a quick search prognosis at the onset of an adult unrelated donor (URD) search. It could be a useful tool for transplant physicians to understand the difficulty of identifying a fully matched or suitably mismatched URD.
The Search Prognosis Application gives one of three search prognosis outcomes:
Good : The patient is likely to have a 10/10 donor.
Fair : The patient may have a 10/10 donor, but will likely have a 9/10 donor
Poor : The patient will unlikely have a 10/10 donor and may not have a 9/10 donor
Although not a replacement for an actual URD search, the genotype frequency offers a quick way for transplant physicians to get an indication of the likely search outcome, engage HLA expertise earlier in a patient search process, and guide early clinical consideration of non-fully matched URD alternative stem cell source options.
For more information, this tool uses methods discussed in Wadsworth et al. 2016
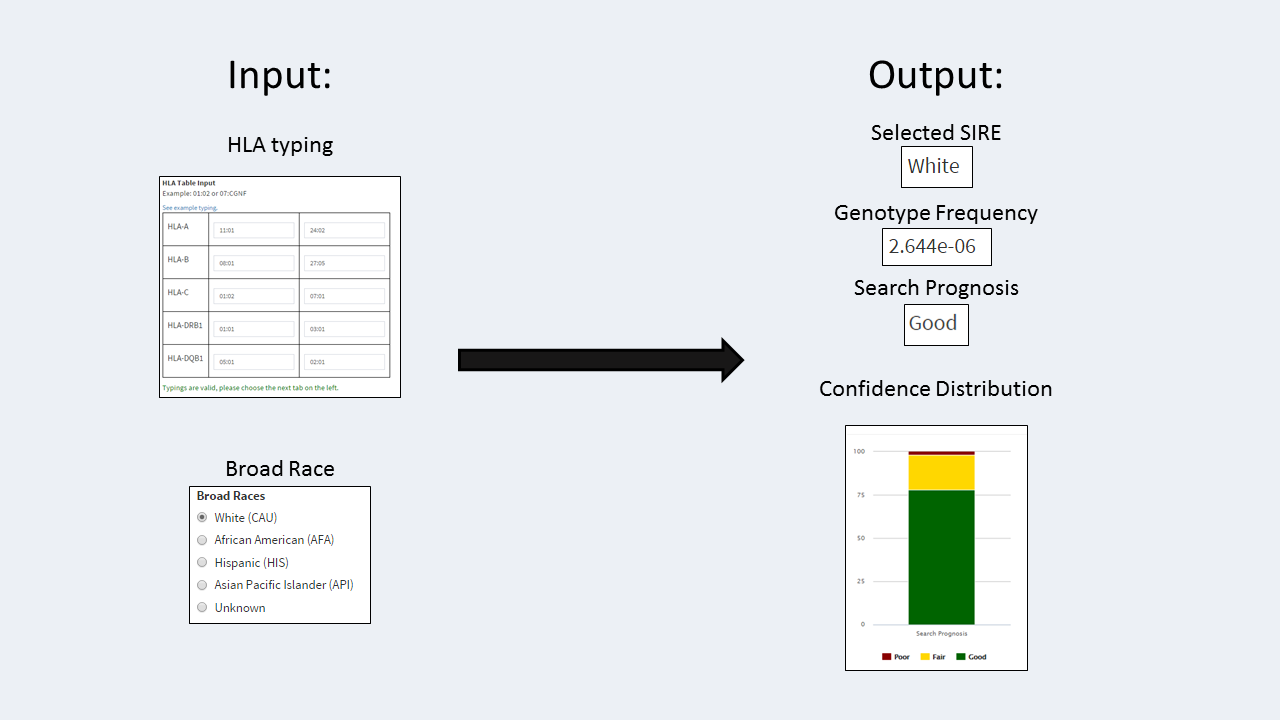
Patient HLA Typing
Using HLA Typing
Please enter one typing per box for each corresponding locus. You should only enter the allele, without the locus. If only one typing is input at a locus, it is assumed to be homozygous. NMDP allele codes are also acceptable input values, however, newer allele codes may not be recognized and should be converted to the most probable (high resolution) allele.
For the most accurate result use high resolution typing at all loci possible. Typing must include at least A and B.
HLA Table Input
Example: 01:02 or 07:CGNF
Self Identified Race and Ethnicity
SIRE (Self Identified Race and Ethnicity)
Self Reported Race is based on the input selection.
Genotype Frequency
Genotype Frequency Information
This frequency is calculated for the most probable haplotype pair based on imputation of the typing.
SIRE Search Prognosis
Search Prognosis Information
Using the Patient's Genotype and SIRE, we calculate the freqency and use a model to predict how this patient would fare during the search process.
SIRE Search Prognosis Confidence Plot
Search Prognosis Confidence Plot Information
This plot shows the probability distribution of the search prognosis prediction. The maximum value is used to determine the search prognosis.
Are you uncertain about the SIRE?
This tab is optional but may be helpful if you are uncertain about the patient's race. This tab uses a statistical method that allows you to consider all four race groups at once. On this page you may choose to adjust the weight given to each race by checking each possible race and selecting how uncertain you are in your selections. The more confident you are, the lower the number should be. If no changes are made, the tool will equally consider each population before looking at the frequencies.
Explore results for all races
The pie chart displays the probability that the patient is from a given population considering the frequency of his/her genotype in each population in combination with the weights that were determined above it. The table shows the results for the patient's genotype in each population including the confidence and overall search prognosis. The confidence plot at the bottom uses the confidence values in the table and weights them by the population probability to calculate a weighted average confidence distribution for each category
Adjust Possible Patient Races
SIRE selected at input:
Likely Patient Race : Choose any race you think the patient is likely to be.
Adjust Uncertainty Level
Adjust Confidence
Using the race selection boxes to the left, you can choose which races will receive weight. The Uncertainty Constant represents how confident you are in your selections and helps to strengthen or weaken those weights. The higher the constant, the less confident you are in your guess and the lower the constant the more confident you are.
Race Probability Pie Chart
Pie Chart Information
This illustrates the probability of the patient's typing belonging to each population. This is calculated by determining the frequency of all the patient's possible genotypes within each population.
Individual Race Calculations
Classifier Table Information
The table below shows the search prognosis spread and scores for each available race. The Population Probability column is based on the selections above.
All Race Search Prognosis Confidence Plot
Classifier Plot Information
The plot shows a weighted sum of the above calculations to show a single search prognosis calculation that considers all the probable populations.